
Breathing in a Better Climate
Georgia Tech researchers monitor and improve our air quality.
As the planet warms, changing weather patterns are only one effect. Warming air is often more toxic, leading to asthma and even heart attacks. A better understanding of these air quality changes can help society mitigate their consequences. Georgia Tech researchers are innovating ways to study air quality — beginning with prehistoric insights and zooming all the way to satellites in our orbit.
Cold Carbon
Unlocking the past’s air quality through ice-core drilling

Graduate student Lifei Yin (left) and postdoctoral researcher Minhan Park (right) collaborate on an instrumentation setup to analyze aerosol size distributions.
What was air quality like in the past? Researchers like Pengfei Liu don’t have to guess. They can drill into the Antarctic ice core and locate aerosol tracers such as black carbon. This type of carbon is formed when biomass — fossil fuels or wood — was burned. The deeper into the ice core, the older the carbon is.
Liu collaborates with the Desert Research Institute to gather and measure aerosol data going back 300 years, to the pre-industrial era. With three centuries of cumulative data from around 31 different ice cores globally, Liu’s team builds computer models to simulate how aerosols move from the emission source into a region.
“We want to know how the black carbon concentration changed over time, which can give us a lot of information about historical wildfires, for example,” said Liu, an assistant professor in the School of Earth and Atmospheric Sciences.
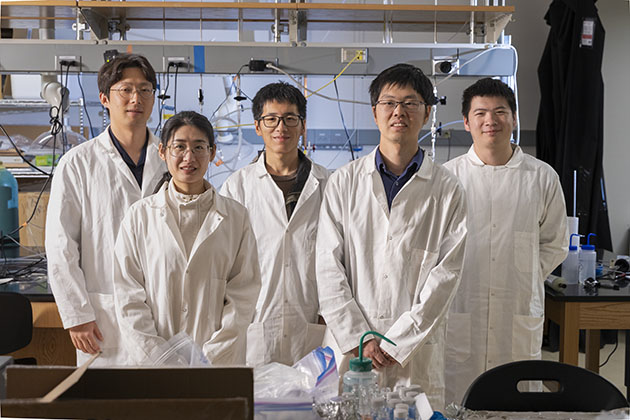
Some members of Pengfei Liu’s research team in the laboratory (l-r): Minhan Park, Lifei Yin, Bin Bai, Pengfei Liu, and Longkun He.
From this past data, Liu can better predict how the climate might shift in the future. Temperature doesn’t change only because of greenhouse gas emissions. Aerosols can also have a cooling effect of their own. So, a more thorough accounting of historic aerosols can help us understand current conditions.
“Our present-day temperatures are a combination of aerosol and greenhouse gas effects,” Liu said. “But most current climate models probably overestimate both.”
From Liu’s ice core data, the researchers estimated that most climate models are up to 30% incorrect for the processes related to biomass burning and can’t fully predict what we can expect in the future. Historical fire activity was likely worse than present-day levels. Mitigating this error rate is crucial to building more accurate climate models, and Liu’s work is the first step.
“Our present-day temperatures are a combination of aerosol and greenhouse gas effects. But most current climate models probably overestimate both.” —Pengfei Liu
Taking the Temperature
Studying how heat affects air quality
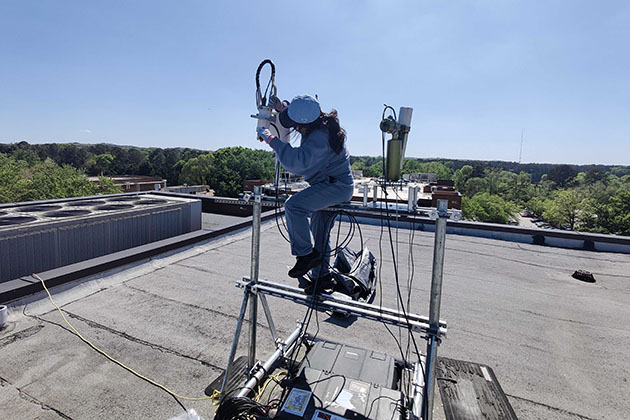
Yakun Zhou, CEE Ph.D. student, installs a Pandora instrument on the roof of Perimeter College-Georgia State University.
It's not your imagination: The air quality is worse on hot, stagnant days. Part of the reason is that emissions from trees and other plants, called biogenic emissions, are higher. For accuracy, models showing how the climate could shift now need to reflect these temperature changes. Jennifer Kaiser, an associate professor in the School of Civil and Environmental Engineering, works to improve these models.
Of course, monitoring the emissions of every single tree is almost impossible from the ground, so Kaiser uses satellite data with funding from NASA. Some of the most influential molecules on air quality can be seen on satellite data: nitrogen dioxide, which comes from cars and power plants, and formaldehyde, which derives primarily from biogenic volatile organic compounds. The satellite data gives the researchers an idea of how many molecules of nitrogen and formaldehyde are in the air.
“I'm deploying instruments around Atlanta to understand the relationship between that measurement from satellites and what we measure here at the ground, and how to use that data most effectively to inform our models,” Kaiser said.
Kaiser uses remote sensing on the ground that captures the air quality above. There are four of these sensors around metro Atlanta. To her surprise, the satellite and ground-based data do align, suggesting this is a promising way of understanding air quality. From there, Kaiser can apply her models and better understand how temperature influences air quality.
“If our mechanistic models have a different temperature response than what we see from the satellite, then that tells us we might need to tweak our understanding of biogenic emissions,” Kaiser said. “It helps us understand where our models might be misrepresenting processes.”
“So, 99% of the time we don't think about electricity generating emissions, or we hop in the car to get groceries without realizing when you drive a gas car for a mile, you're putting a pound of carbon dioxide into the atmosphere.” —William Drummond
Aerosol Arithmetic
Breaking down the chemical composition of aerosols
Aerosols are the foundation of good or bad air quality. Rodney Weber, a professor in the School of Earth and Atmospheric Sciences, studies their chemical composition and how chemical alterations can affect their toxicity and visibility. In other words, how does the changing chemistry of aerosols affect human health and the environment?
“We are developing methods to characterize the aerosol species we believe are most important and possibly have more of a biological connection to adverse health effects,” he said.
In Atlanta, for example, aerosol composition has shifted. While aerosols used to come from sulfate emitted by power plants, they are now more likely to originate from vehicle exhaust and even trees. Understanding the different toxicities of these sources is essential for accurate health assessments. Weber even developed an instrument that collects water-soluble aerosol particles, grows the particles in water droplets, and then analyzes those droplets to determine their composition.
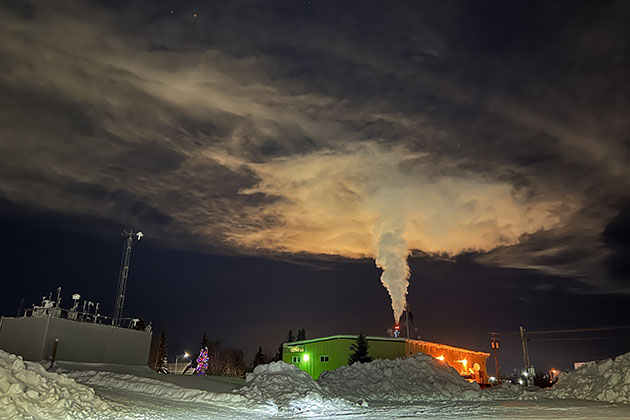
Pollution plumes in Fairbanks, Alaska, are prevalent during the cold winters.
This tool provided a surprising connection between metals like iron, in a certain form found in aerosols, and increased heart attacks in Atlanta. Most iron in aerosols is not soluble, coming from vehicle brake wear, road dust, or wind-blown mineral dust. When this iron is transformed into a water-soluble form, the toxicity is much higher. This transformation happens in the liquid water in aerosol particles when they are highly acidic. Sulfate affects both; it absorbs water vapor to form liquid water aerosols that contain the iron and sulfate that make the particles acidic. Sulfate aerosols have decreased in the city due to fewer emissions from coal-fired power plants, and this has resulted in less water-soluble iron and less toxic aerosol.
Surprisingly, despite the drop in sulfate, the aerosols have remained at a very low pH. “The aerosols in Atlanta are really acidic; aerosol liquid water and pH affect the metals’ solubility, making them more bioavailable,” Weber noted. The main effect of the decrease in sulfate was a reduction in liquid water, but the acidity of the drops has remained about the same.
He expanded this study by bringing the tool to Fairbanks, Alaska, during winter, where his lab determined that temperature has a major effect on aerosol acidity. They are often more acidic in the summer, given warmer temperatures. This can explain seasonal variations in air toxicity.
Emissions from wildfires also greatly affect aerosol liquid water and pH. All this data paves the way for stronger environmental and health policies. As wildfires increase and pollution sources shift, understanding aerosols is pivotal to maintaining good air quality.
Carbon Clue
Monitoring greenhouse gas emissions may help Atlanta get to net zero by 2050
A snapshot of the data the emissions tracker includes. (Click the image to view a larger version.)
Tracking carbon emissions is the first step to lowering them. Since 2022, Georgia Tech researchers have monitored Georgia’s greenhouse gas emissions using a carbon tracker. The interactive map lets anyone filter publicly available greenhouse gas estimates by county, month, year, and energy sector. These energy sectors include transportation, agriculture, commercial, forestry, residential, and industrial sources; users can also see how an area’s trees absorb some of this carbon. The work has received multiple years of funding from the Ray C. Anderson Foundation.
Recently, the researchers have also made a city-specific tracker that can pull data from 217 of the state’s cities, including Atlanta, Savannah, and Columbus. This tracker estimates emissions in each city by extrapolating from county data. The Atlanta Regional Commission (ARC) has been particularly interested in and relied on the data to develop a climate action plan for the metro area that encompasses everything from expanding transit options to making a more efficient energy grid.
“We were very pleased the trackers ended up being a key piece in the metro area’s Climate Action Plan as our planet warms,” said William Drummond, an associate professor in Georgia Tech’s School of City and Regional Planning. “Even though carbon emissions are the bad-news side of the climate equation, we’re glad we can help better understand their effects.”
The Ray C. Anderson Foundation has a goal to reach net-zero Georgia emissions by 2050. The carbon tracker is pivotal to hitting this metric.
“Tracking emissions is an essential part of reaching net zero to make us aware of where emissions come from,” Drummond noted. “So, 99% of the time we don't think about electricity generating emissions, or we hop in the car to get groceries without realizing when you drive a gas car for a mile, you're putting a pound of carbon dioxide into the atmosphere.”
With Drummond’s work, the ARC is developing a plan to get metro Atlanta to net zero by 2050. The tracker is just one part of the action plan, but it will lead to more momentum to ensure the region can thrive in our changing climate.

Writer/Media Contact: Tess Malone | tess.malone@gatech.edu
Photography: Chris McKenney and courtesy of Georgia Tech researchers
Copy Editor: Stacy Braukman
 Unearthing Climate Solutions
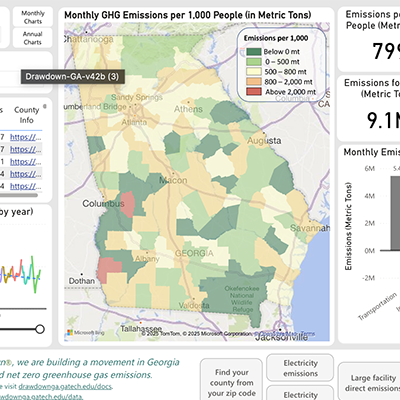 Carbon Tracker Lets Georgians Monitor Emissions
 In Fairbanks, Alaska, Researchers Unravel Frigid Air Pollution
Climate Series
The climate is changing — and so is the way we respond. Georgia Tech researchers from across disciplines are teaming up to tackle the challenges of a warming world. From tracking air quality in urban environments to studying ancient fossils for clues about Earth’s past, these experts are driving innovations in climate resilience and mitigation.
Follow our new series to explore how Georgia Tech is helping shape a more sustainable future.


